Chart Formatting, part 1
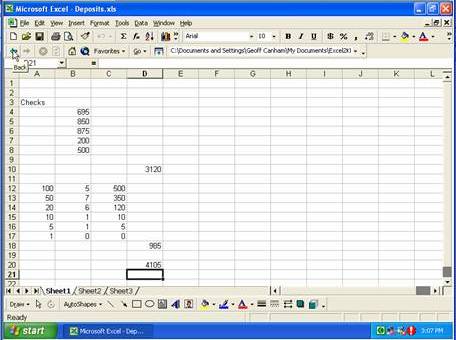
Here we have a file that was opened by means of a hyperlink from another spreadsheet, and clicking the Back button on the Web toolbar will reopen the original spreadsheet.
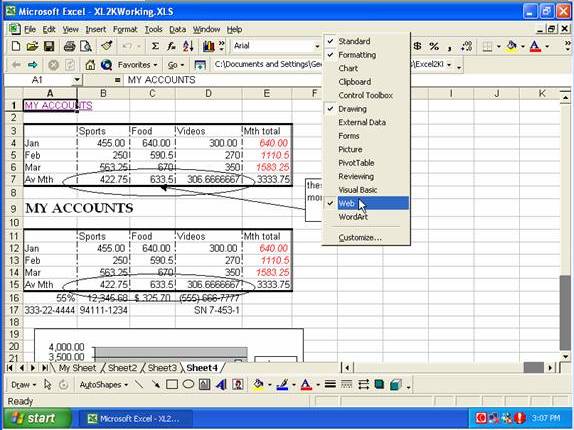
To close the Web toolbar, right-click on a toolbar and deselect Web
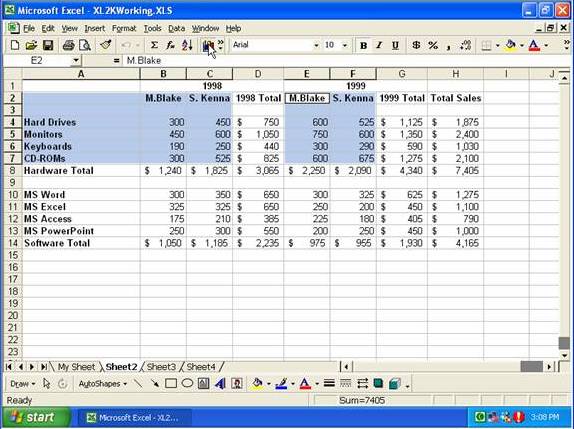
To select separate blocks of cells, click in a corner cell of one block, hold the Shift key and click in the diagonally opposite corner (which will select one block), release the Shift key and hold down the CTRL key and click in one corner cell of the second block, release the Ctrl key and hold the Shift key and click the diagonally opposite cell for the second block. With your cells now selected you can click the Chart Wizard.
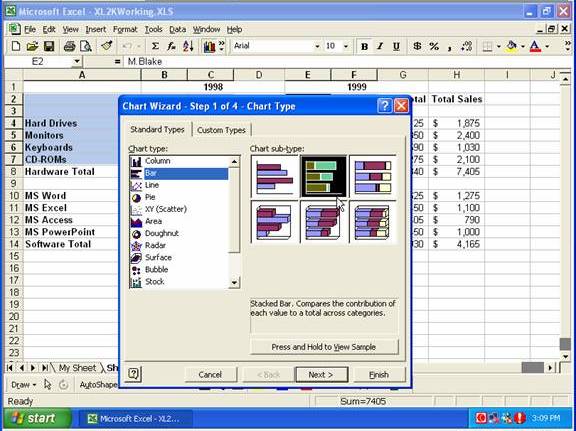
On the Standard Types tab we are selecting Bar in Chart Type, and Stacked Bar in Chart sub-type, then clicking Next.
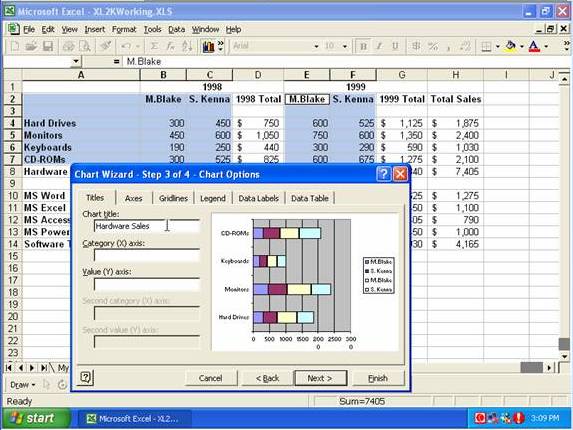
On the third step of the wizard we are adding a Chart Title, then we click Next.
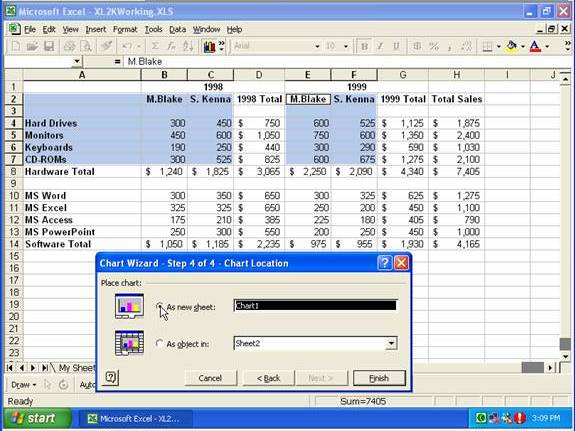
Here we are selecting ‘As New Sheet’ under Place Chart, and then clicking Finish.
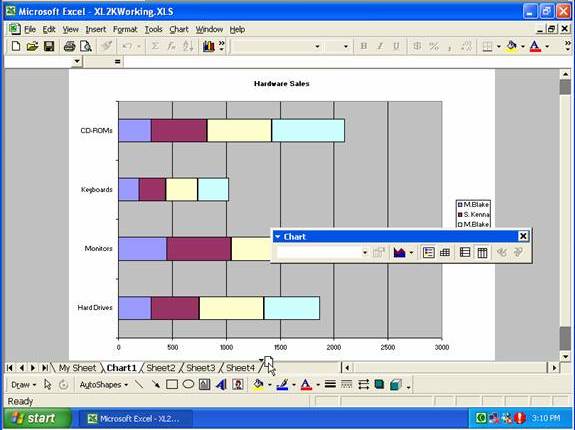
You can click on the tab for the sheet containing the chart and drag it to a new position in the workbook.
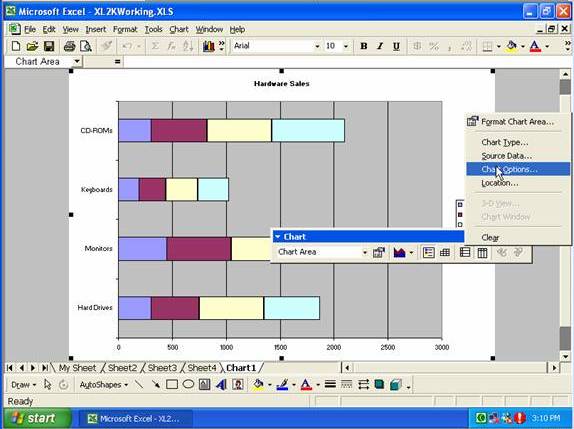
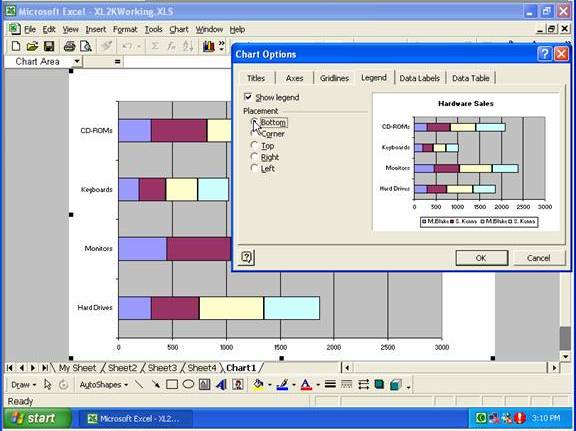
Right-clicking on an empty area of chart background gives you a shortcut menu including Chart Options.
On the Legend tab in the Chart Options dialog box, you can select where to place the legend (or if to display the legend at all), then click OK (or you could simply click the legend and drag it to a new position)
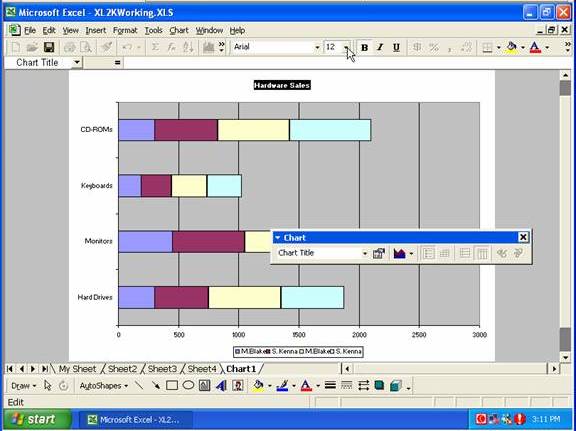
To format the heading text, select the heading text (move the Chart toolbar first if necessary), then apply the necessary formatting
Right-clicking on the Chart Area background gives a shortcut menu including Chart Type.
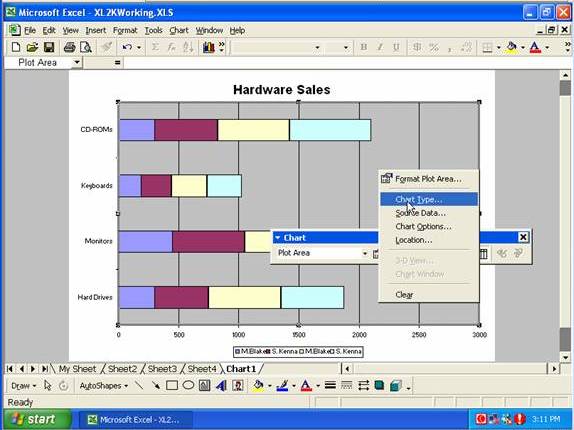
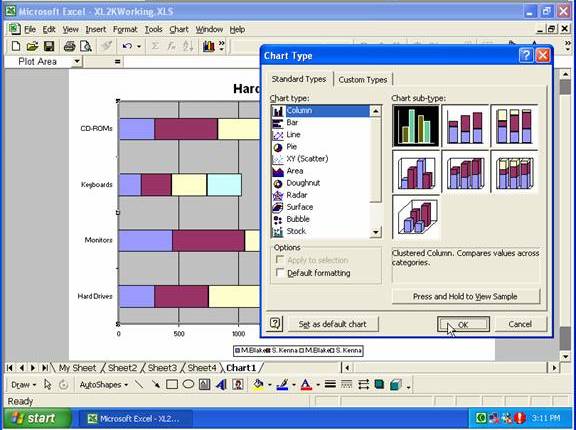
Here you can change the chart type, then click OK
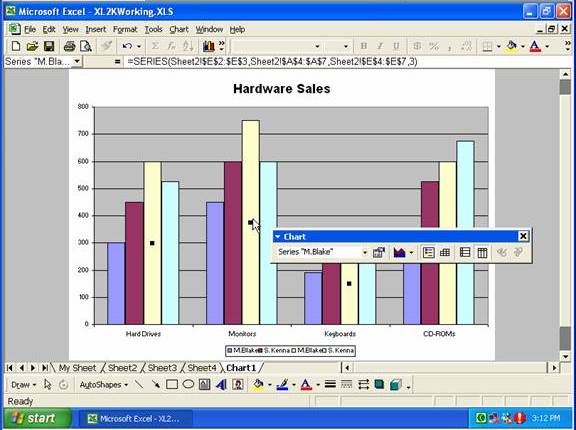
To change a data marker (i.e. the columns on a bar chart), double-click on one of them …
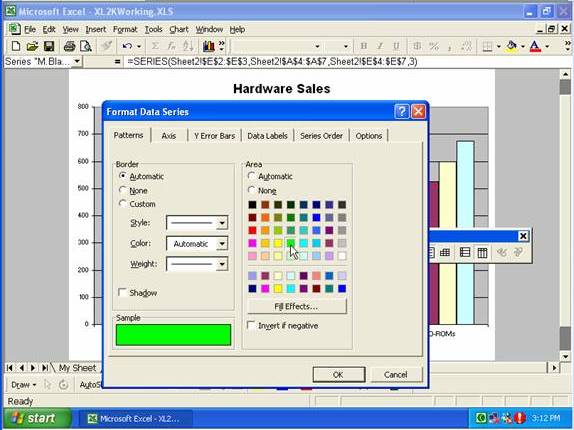
… which will bring up the Format Data Series window, and on the Patterns tab you could change the color for the marker, then click OK
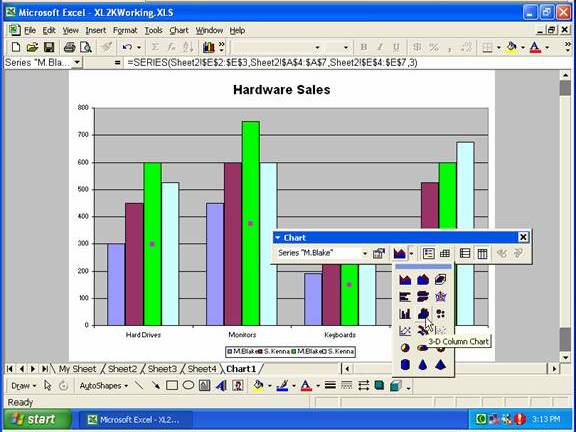
Another way to change the chart type is to have the chart toolbar showing (if necessary, right-click any toolbar and select Chart) and click the Chart Type drop-down arrow and select a new type
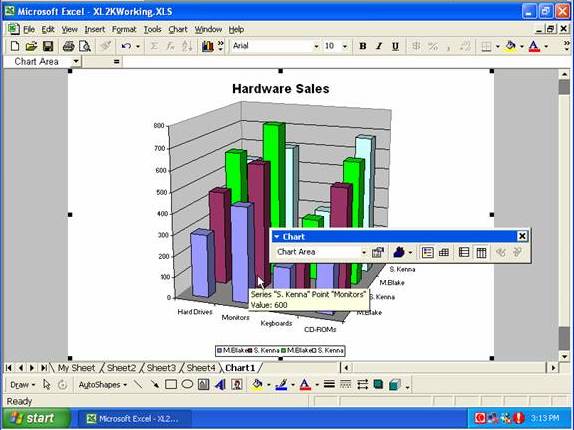
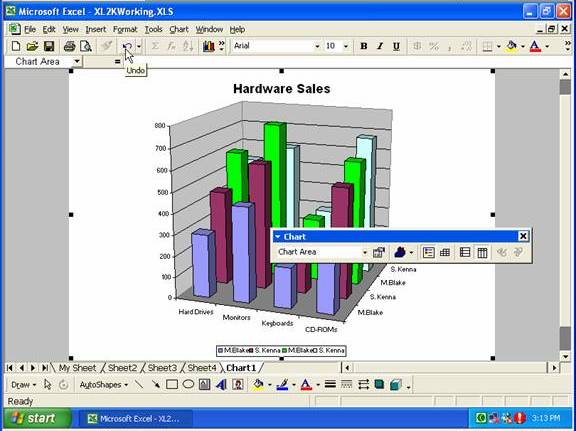
Here we have the same chart in a 3-D type:
Click Undo will take you back to the previous chart type.
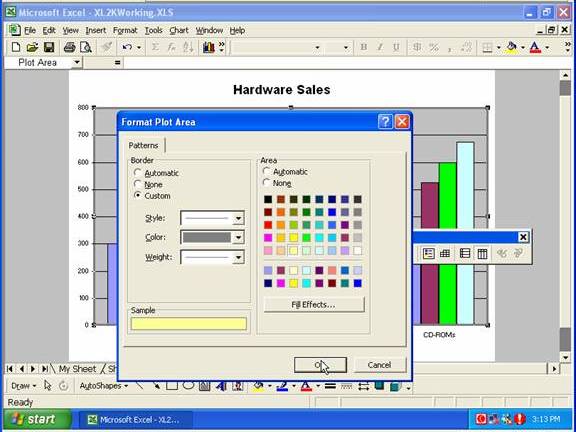
Double-clicking on an empty area on the chart background (between the columns) will bring up the Format Plot Area window, where you can change the background color for the chart
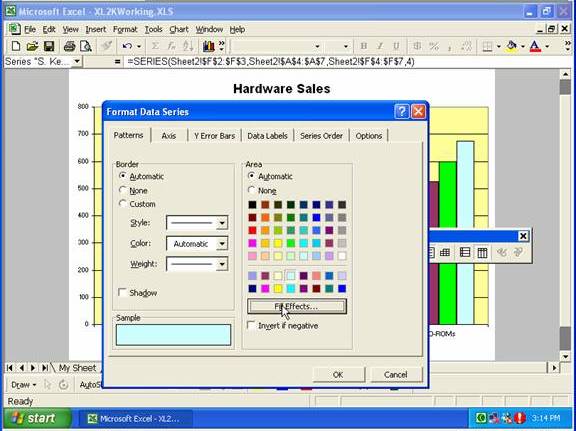
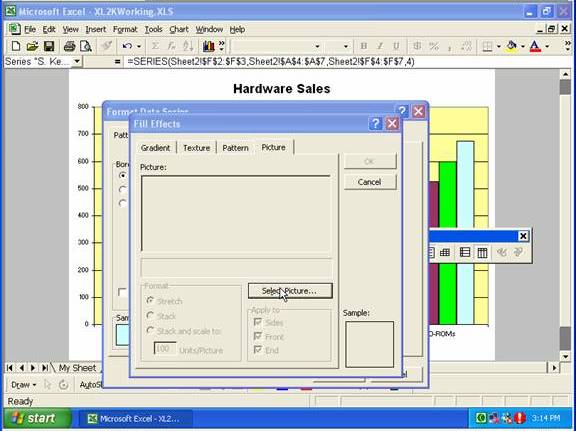
To use an image on a data marker, double-click one of the markers, in the Format Data Series dialog box select the Patterns tab, Fill Effects button …
… go to the Picture tab on the Fill Effects window …
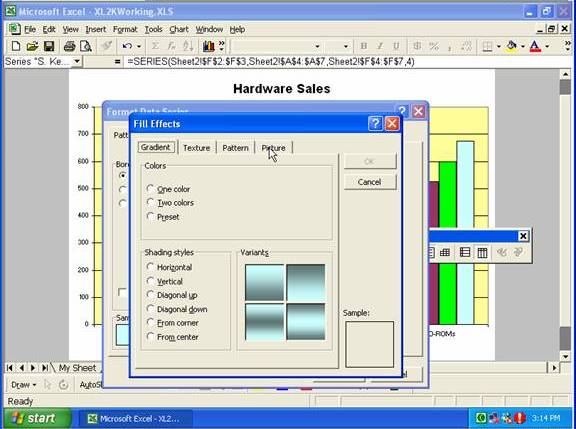
… click the Select Picture button …
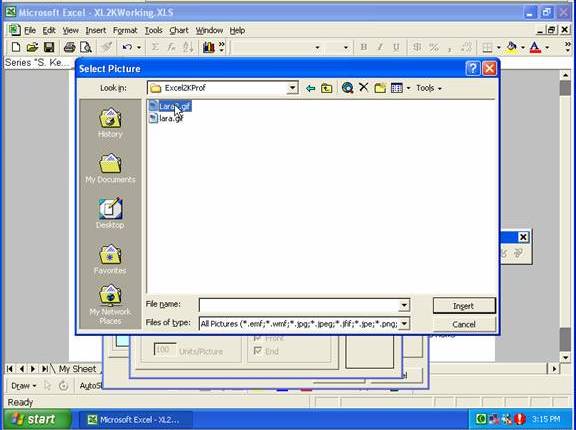
… browse to the appropriate folder and double-click on the required image file …
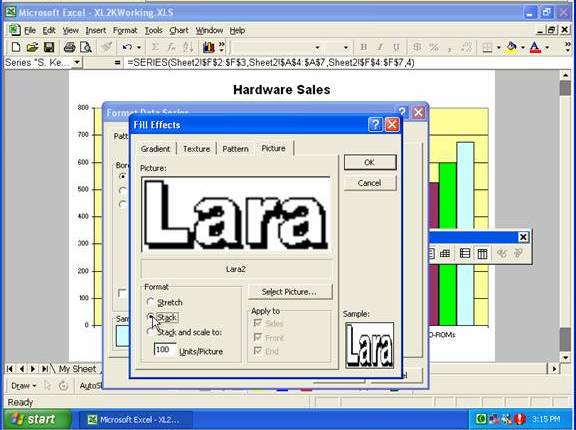
… then you can select if you want the image to Stretch or to Stack within the data marker, then click OK, OK
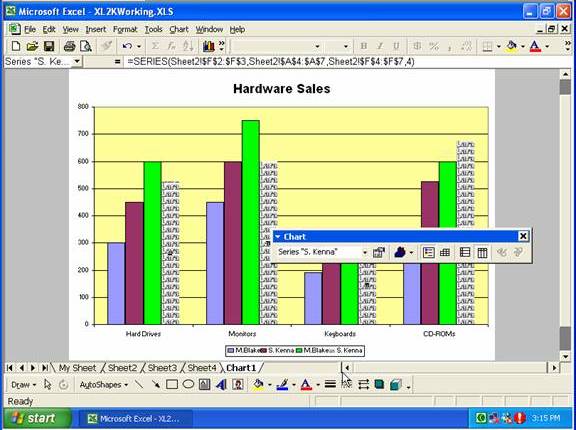
And here we have the data markers for one series displaying the selected image:
Copyright www.LaraAcademy.com